A single source of truth for what needs to be built and whether it is on track: one master schedule broken into packages, daily site logs, and an S-curve that shows the moment the timeline slips.
Rostdorstroy LLC's teams were tracking progress across a scattered mix of spreadsheets and site photos, with no single schedule that showed whether a package was actually on pace or quietly slipping.
Owners and site managers had no shared view of what still needed to be built, who was behind, and which blockers were actually holding up the critical path.
Screens below are the live product, not mockups.
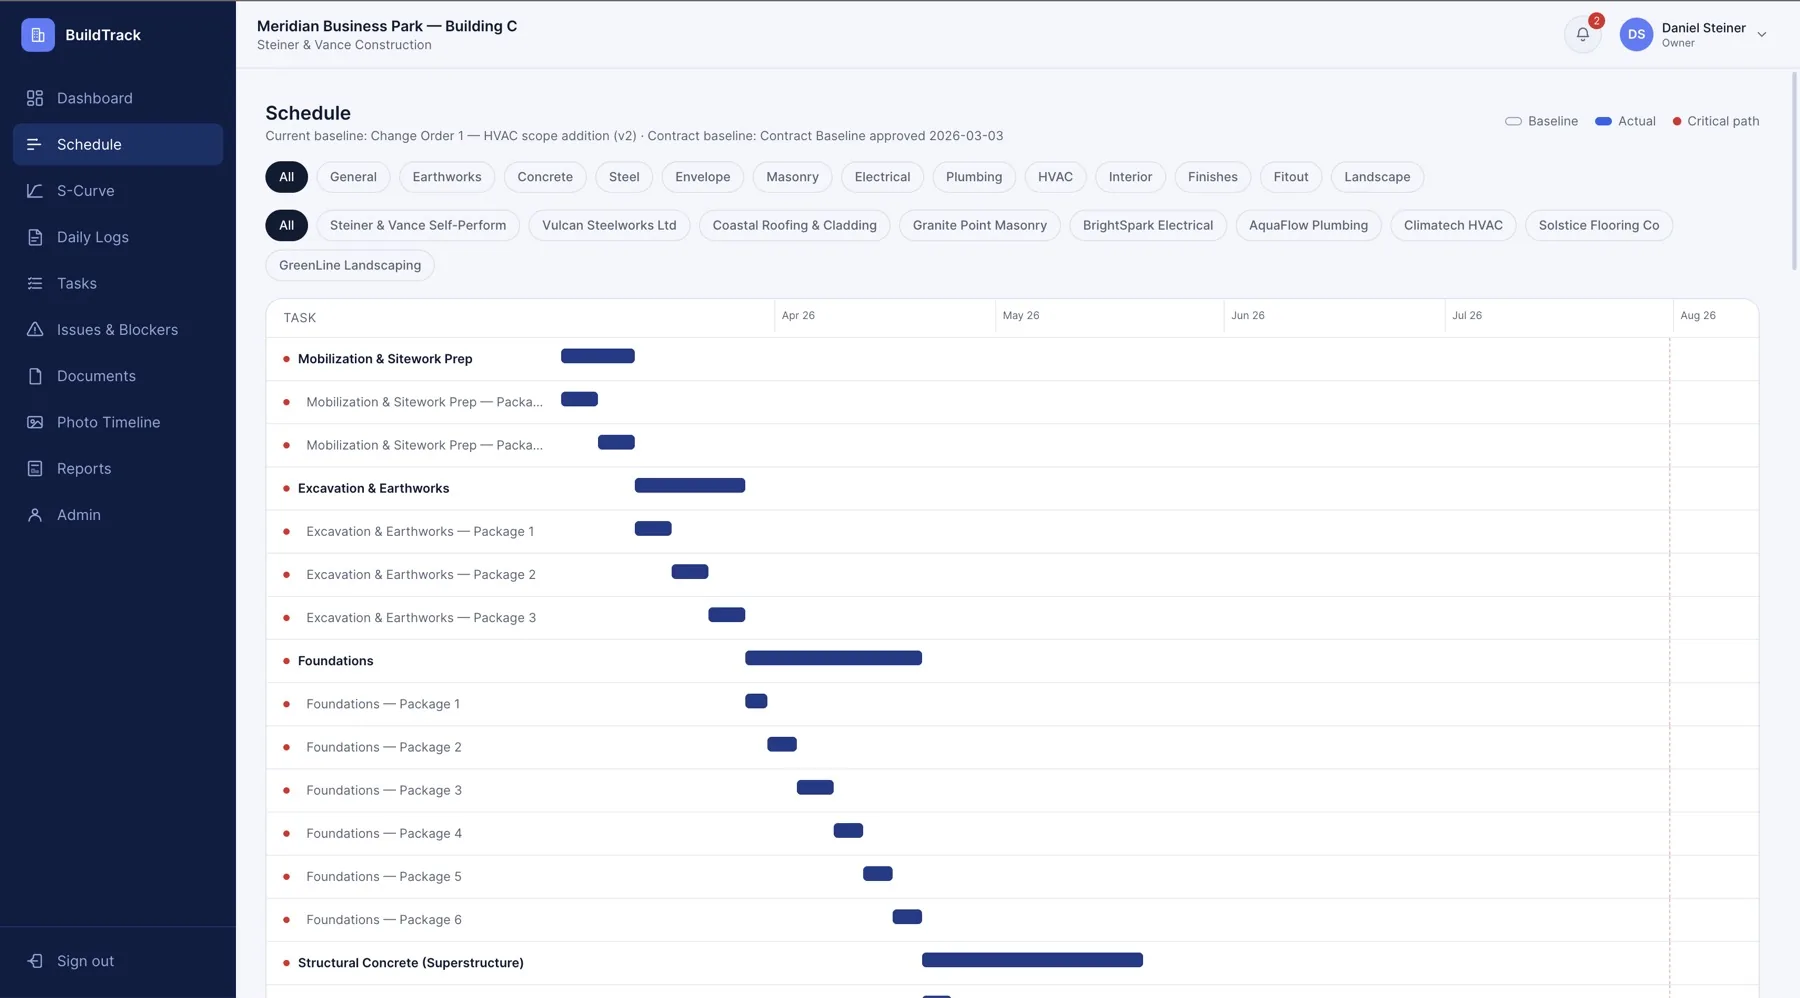
Every discipline is broken down into packages against a single baseline, with the critical path marked and change orders tracked as the schedule moves.
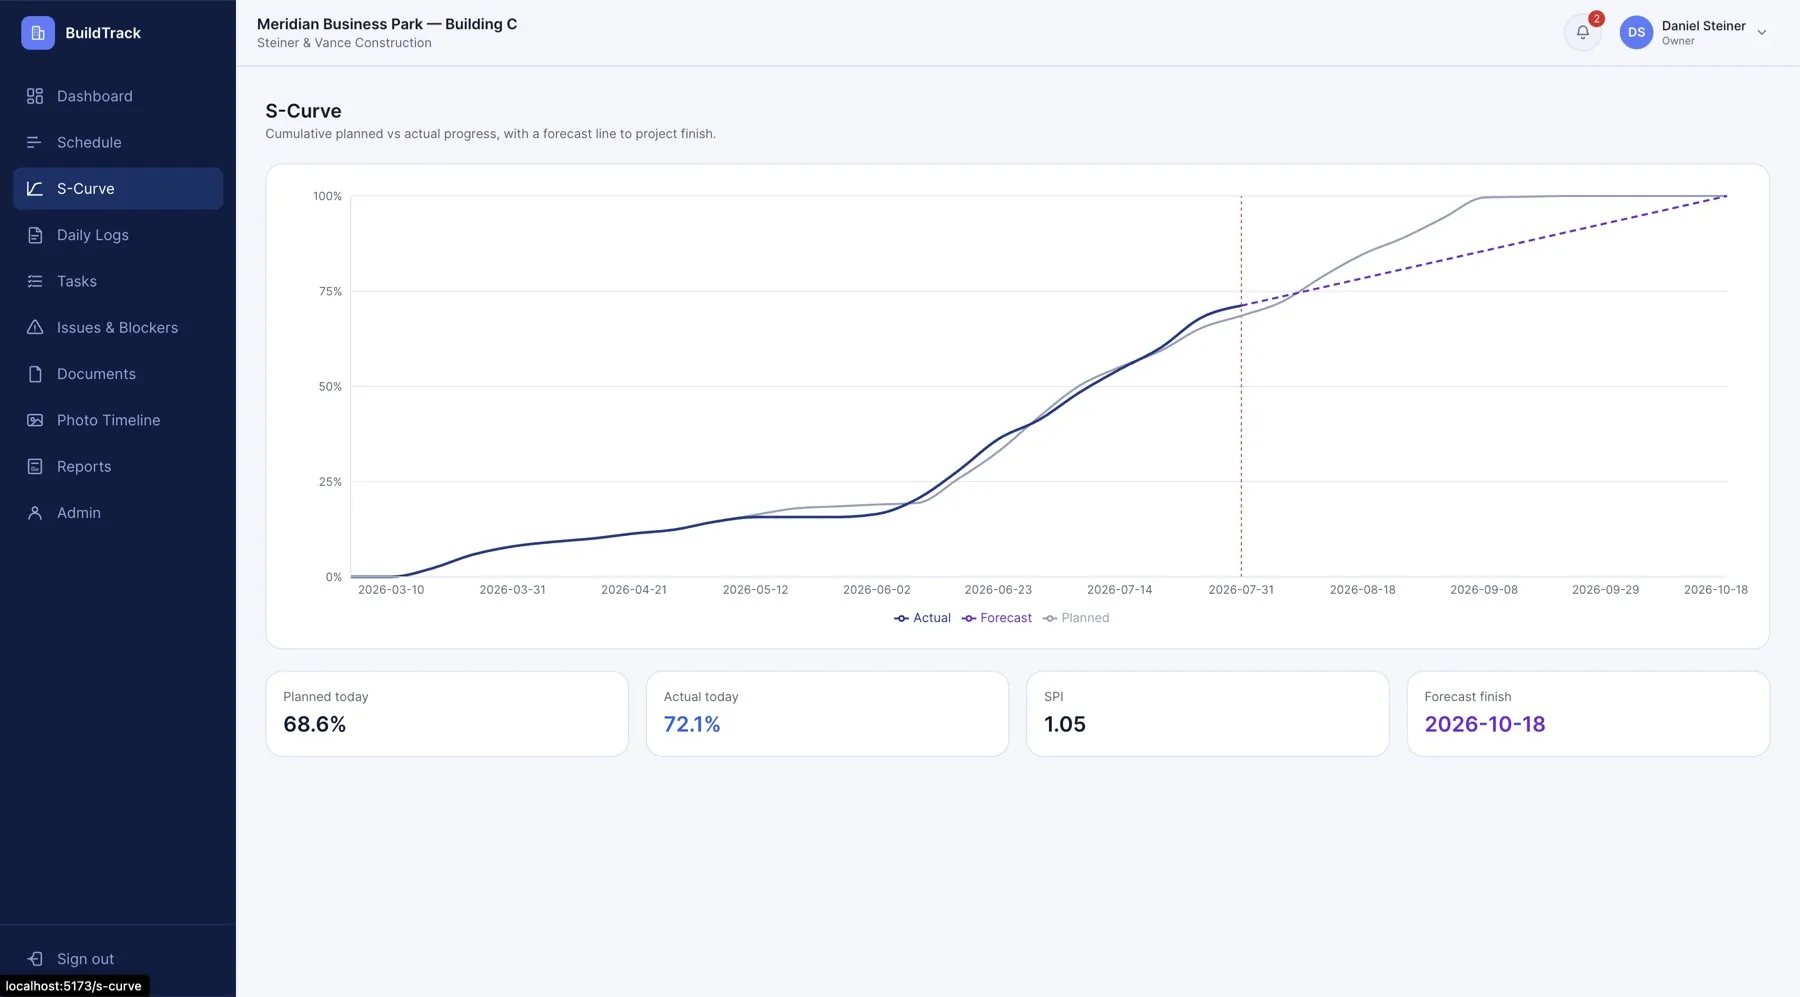
Planned versus actual progress plotted as a cumulative curve, with SPI and a forecast finish date that updates as real progress comes in.
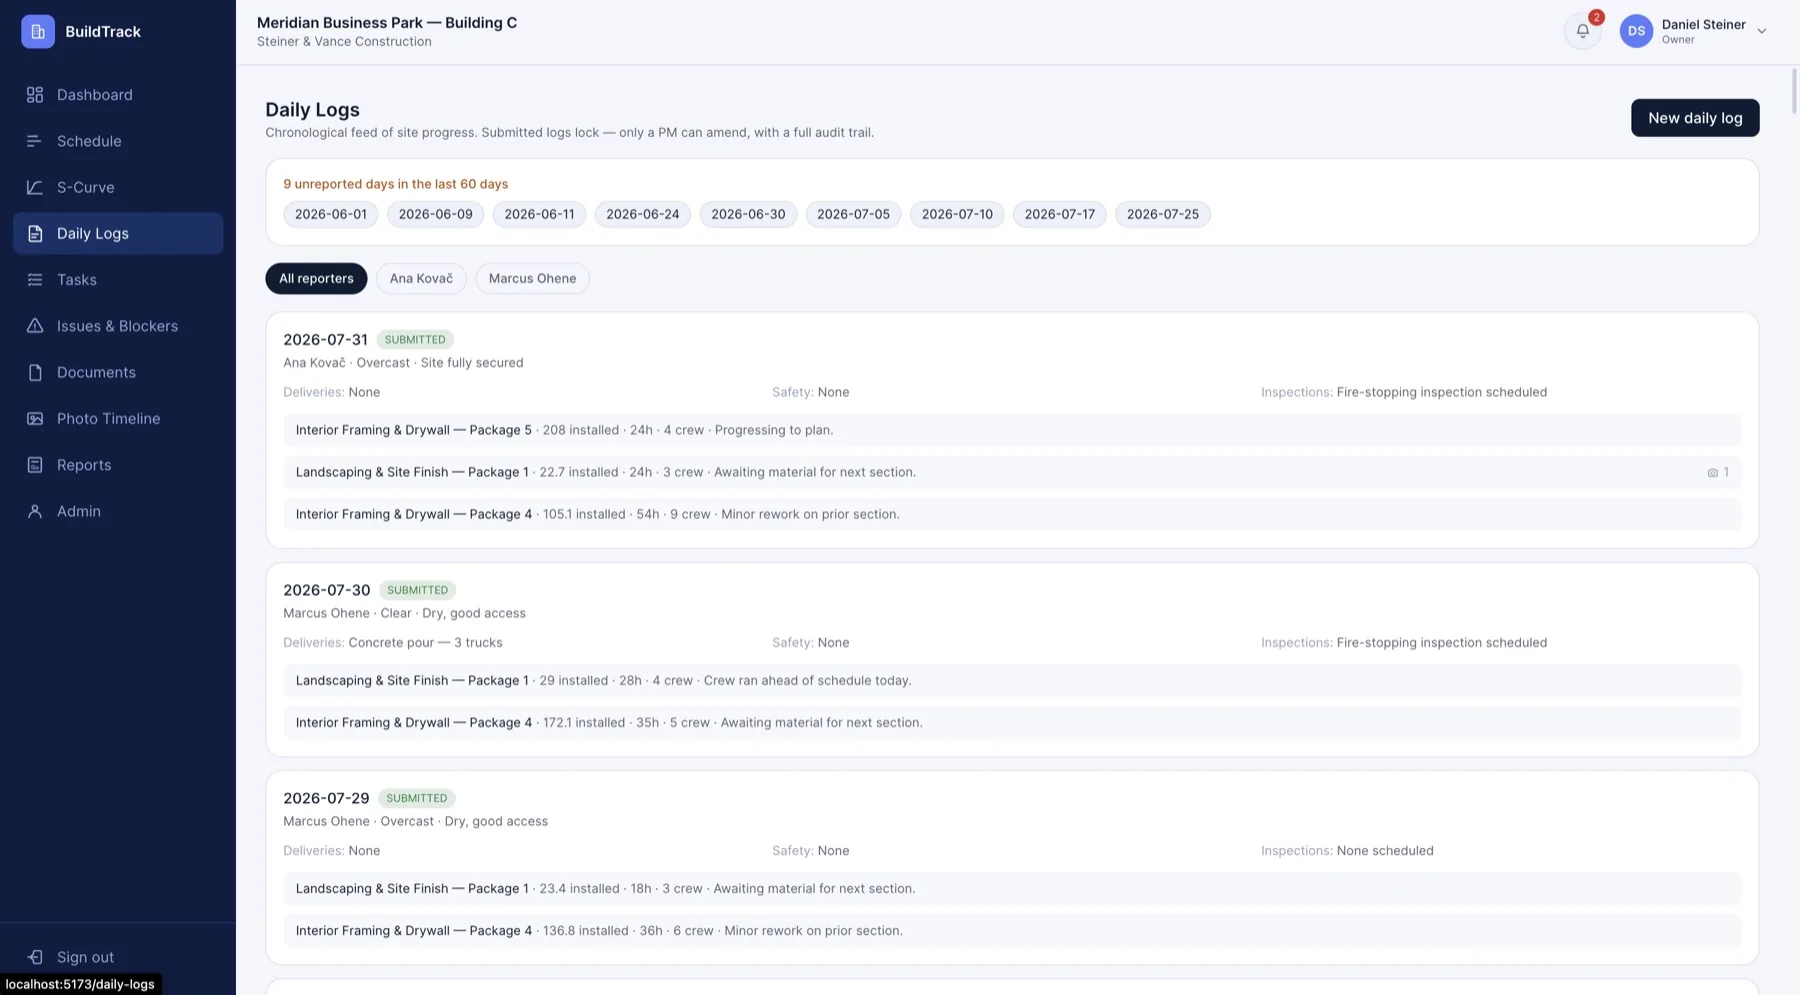
Site managers log weather, deliveries, safety notes and package-by-package progress every day, with submitted logs locked and only a PM able to amend.
Open blockers are flagged by severity and critical-path status, and anything ageing past ten days on the critical path escalates automatically.
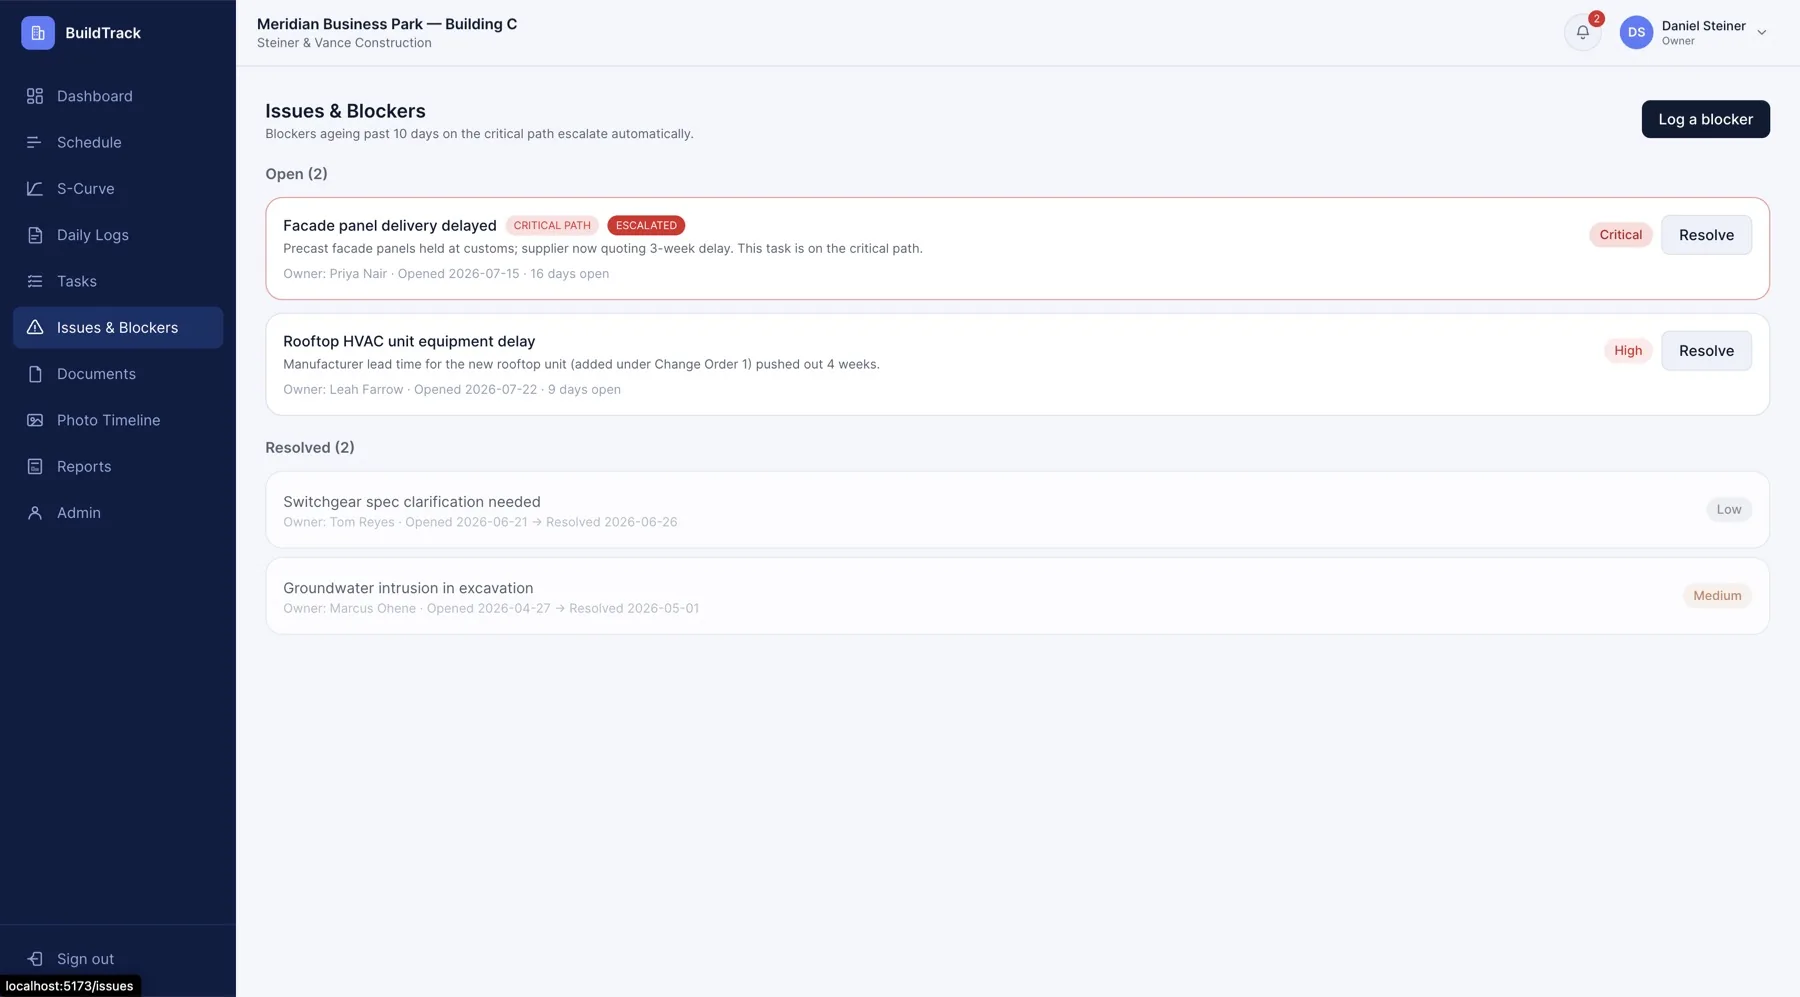
Rostdorstroy LLC's owners can see, at a glance, whether a project is ahead or behind, exactly which package is the reason why, and who is accountable for closing it out. Meridian Business Park. Building C is running 7.2 days ahead of schedule at 72.1% complete, with every blocker on the critical path visible the moment it is logged.
Tell us what you are trying to solve and we will come back with a clear quote within 24 hours.
Get your quote